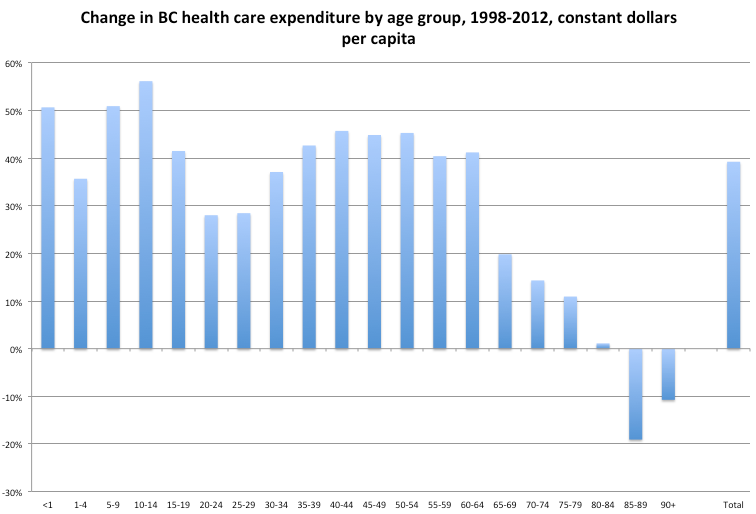
Let’s break down changes in health care spending by age group. You might think that as overall health care spending in B.C. has gone up, we would see bigger jumps for those over age 65. But this is not the case — indeed, quite the opposite. This figure shows the change in health care spending per person between 1998 and 2012, after adjusting for inflation, by age group.
While total health care expenditures increased by 39 per cent (right-most column), for seniors (age 65+) the picture is shocking: outright declines for those over 85; increases well below average for those 65-84. To the extent any age group is driving health care expenditures, it is predominantly the middle-aged groups. [Note: 1998 and 2012 are the start and end years of the time series available from the Canadian Institute for Health Information, Tables in E section.]
So what’s going on here? The available data break expenditures down into major groups like hospitals, physicians, drugs and other institutions (which includes long-term care for seniors). When we look at these breakdowns, we find that the main driver is residential care cuts after 2002. In total budget dollars, expenditures for “other institutions” peaked at $1.65 billion in 2002, then fell to just under $1 billion in 2012. During that time total provincial health care spending grew from $10.7 billion to $17.2 billion, so these cuts can get buried in the overall funding picture. Compounding that dollar cut are inflation and population growth.
This table summarizes the changes between 2002 and 2012 for residential care expenditures for seniors (65+), per person, and adjusted for inflation:

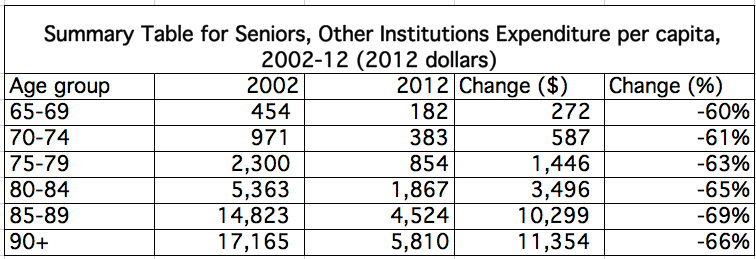
The decade from 2002 to 2012 was clearly a dismal one for residential care, with expenditures per person falling by more than 60 per cent for all groups of seniors 65+.
The B.C. experience is a major outlier compared to other provinces. Up to 2002, B.C. was among the top provinces in terms of per capita expenditures for residential care. By 2012, B.C. was dead last by a huge margin. This figure just shows the three oldest groups (80-84, 85-89 and 90+), with the drop for B.C. between 2002 and 2012 from the darker blue to the red, while Canada as a whole saw an increase in expenditures (the purple to the turquoise):
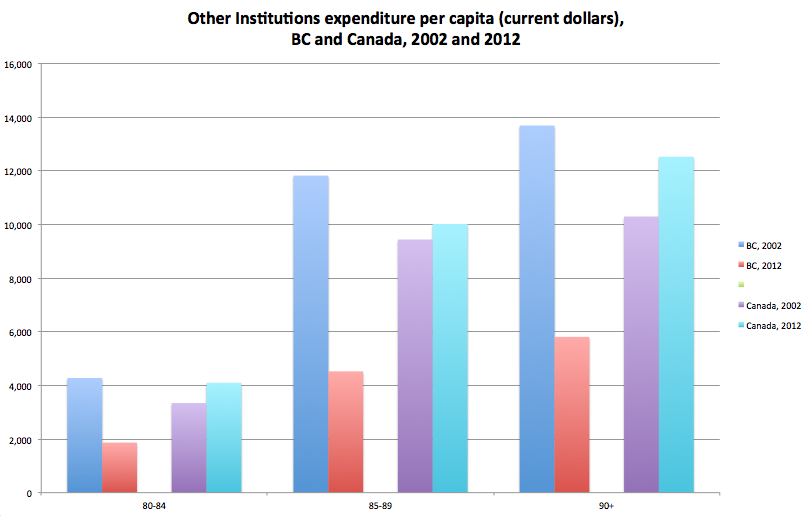
(Note these are unadjusted for inflation; doing so would make the trends look worse for B.C.)
If B.C. could be brought up to the national average, it would dramatically improve health care services for seniors. Home care is another area of interest in terms of the real impact of cuts on seniors, but the data do not allow us to do the same type of comparisons. But the bottom line is clear: residential care services have been experiencing austerity for a long time, and this adversely affects the quality of care we are providing to seniors in B.C.
Support rabble today!
We’re so glad you stopped by! Thanks for consuming rabble content this year.
rabble.ca is 100% reader and donor funded, so as an avid reader of our content, we hope you will consider gifting rabble with a donation during our summer fundraiser today.
Whether it be a one-time donation or a small monthly contribution, your support is critical to keep rabble writers producing the work you’ve come to rely on as a part of a healthy media diet.
Whether it be a one-time donation or a small monthly contribution, your support is critical to keep rabble writers producing the work you’ve come to rely on as a part of a healthy media diet.
Become a rabble rouser — donate to rabble.ca today.
Nick Seebruch, editor